Case Study: Data Analytics & Product Strategy
Operating Across the Country
Leading data analytics and product strategy for the Tauber Institute for Global Operations, turning a data request into a decision-support tool that helps the Institute plan smarter alumni events and long-term engagement.
Operations & Strategy
Data Analysis & Science
Client
Tauber Institute for Global Operations
Timeframe
Winter 2026
Role
Data Analytics Lead & Product Strategy
Team
5-Person Team, SOCHI Tech Consulting
Tools


1,016
Alumni records analyzed across two decades of cohorts
22 Years
Of cohort data, confirmed by the Analyzer itself
11
Interactive views built into the Alumni Analyzer

My Role
Why Tauber Needed This
Every year, the Tauber Institute hosts alumni events to reconnect graduates and strengthen its network. After lower attendance at the previous year’s Seattle event, the Institute wanted to better understand where alumni were located and how to improve future engagement. They already had years of alumni data, but lacked an effective way to turn that information into planning decisions.
The Challenge
A Slipping Alumni
Event
Last year’s Seattle alumni event drew lower attendance than expected, hurt by reduced engagement and a last-minute venue change.
Goals Bigger Than a Spreadsheet
Tauber wanted more than historical trends: a clearer picture of where alumni are, how they’re connected, and how to build a stronger long-term community.
One Ask, Two Workstreams
What started as a data analytics request split in two: platform research for the future, and data-driven decisions for right now.
Process
Step 01
The ask looked like a data analytics request: analyze the alumni spreadsheet, report what we found. But underneath it was a real organizational problem: an alumni event that had just underperformed, and a broader push to build a stronger long-term engagement strategy. That reframing shaped everything that followed.
Alumni Visibility
Increase visibility into where alumni are and what they’ve gone on to do professionally.
A Maintainable Record
Establish a record structure the Institute can keep accurate without starting over each year.
Alumni on a Map
Display alumni data geographically to support outreach, events, and reconnection.

Alumni cohort size by graduation year, straight from the Institute’s original dataset, one of the first patterns we looked at.
Step 02
As the engagement evolved, the work split in two. One part of the team researched platform and API options for a future alumni system. I led the data analytics workstream, focused not on what Tauber might build someday, but on how they could make better decisions with the data they already had, today.
Geography & Life
Where alumni live and work, city by city.
Employers & Industries
Which companies and sectors alumni have moved into.
Degrees & Projects
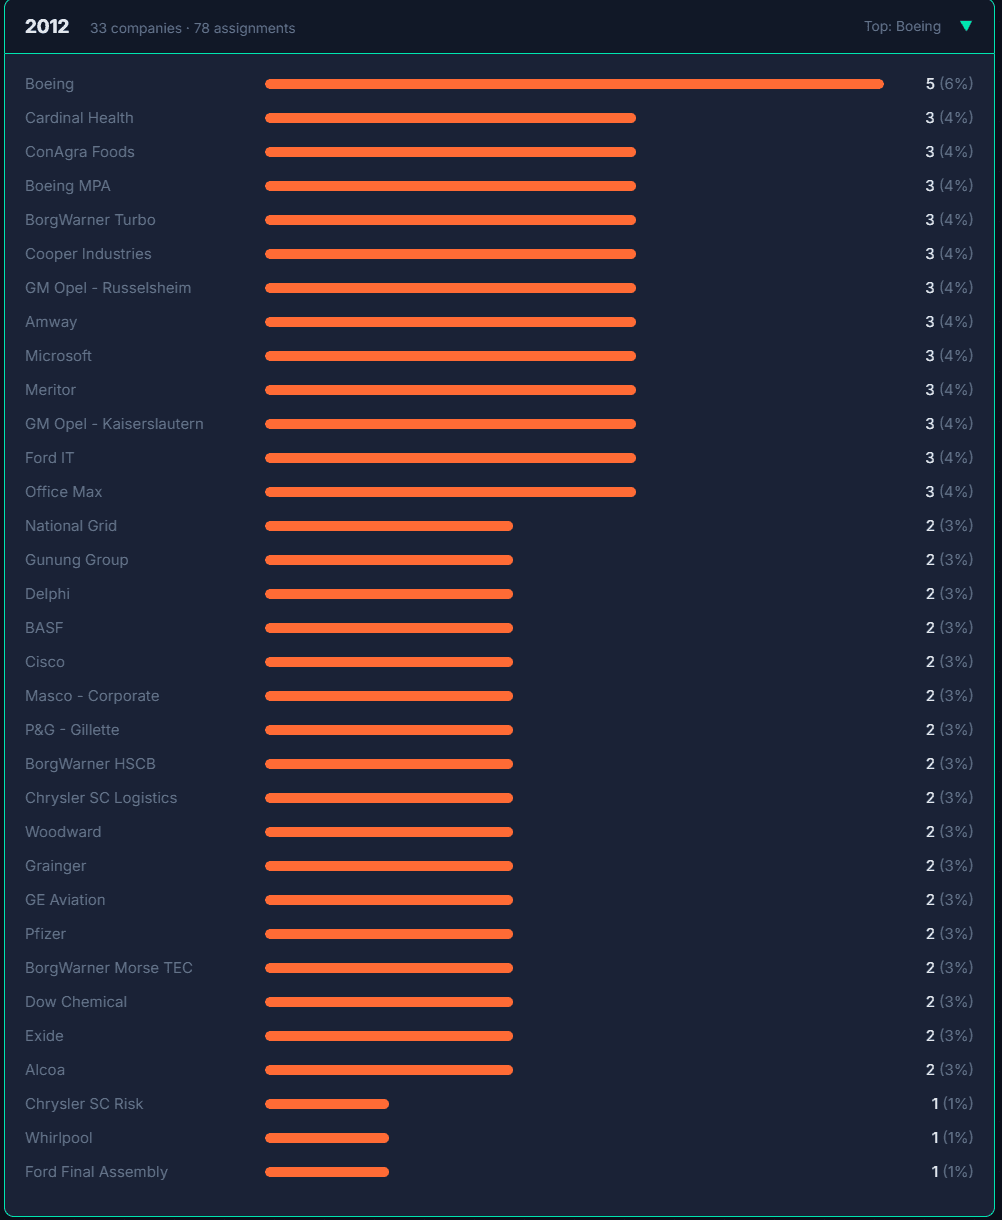
Degree programs completed and Tauber project assignments by year.
Contact Coverage
How much of the record set is actually reachable: email, phone, and LinkedIn.
Step 03
Rather than producing static charts for a final presentation, I built the HTML Alumni Analyzer, not a visualization exercise, but a reusable decision-support tool. Every time Tauber updates its spreadsheet with new graduates, the same patterns that used to take hours to find are available instantly.
Runs entirely in the browser. Drop in the alumni spreadsheet and instantly see: contact and field completeness · degree breakdown · graduation year distribution · project year and assignment history · top employers and industries · geographic distribution · gender breakdown · Do Not Contact coverage. No server, no upload, nothing leaves the computer.
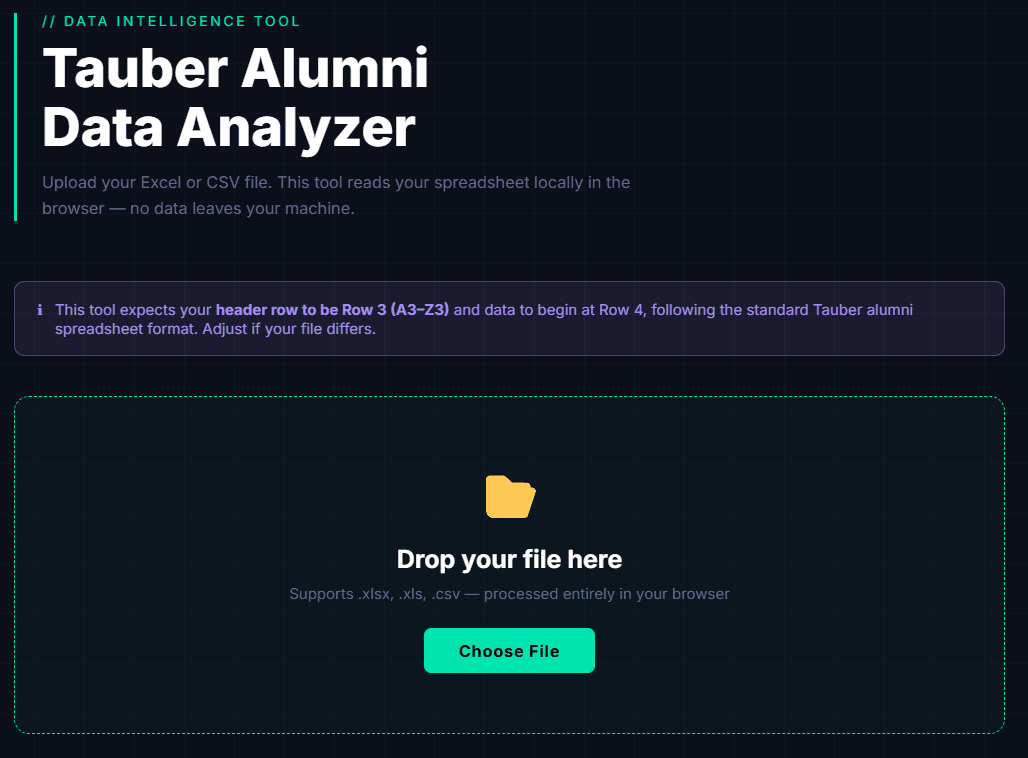
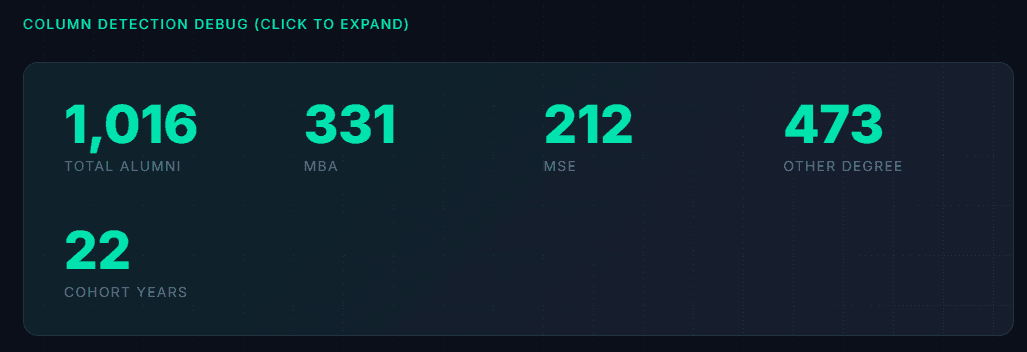
The actual tool: drop in the spreadsheet, and it reads 1,016 alumni across 22 cohort years instantly, entirely in the browser.
Outcome
What this project became
Key Findings
About one in five alumni records included a last-reported job title, alternate email, and work city: enough real signal to run targeted outreach. One pattern stood out: among alumni with a known work city, Chicago narrowly edged out Seattle, 12 to 10 (Seattle is Tauber’s traditional event location). That’s not a recommendation to move the event. It’s evidence that engagement strategy should be guided by where alumni actually are, not by where events have always been held.
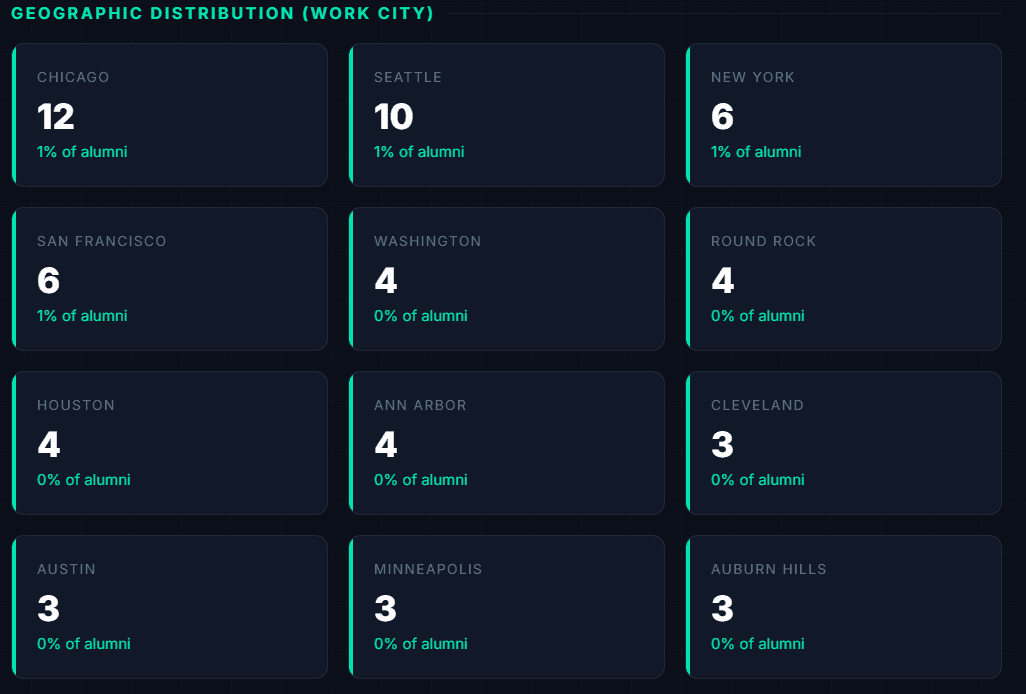
Chicago narrowly edges out Seattle: a data point for planning, not a verdict on the event’s home.
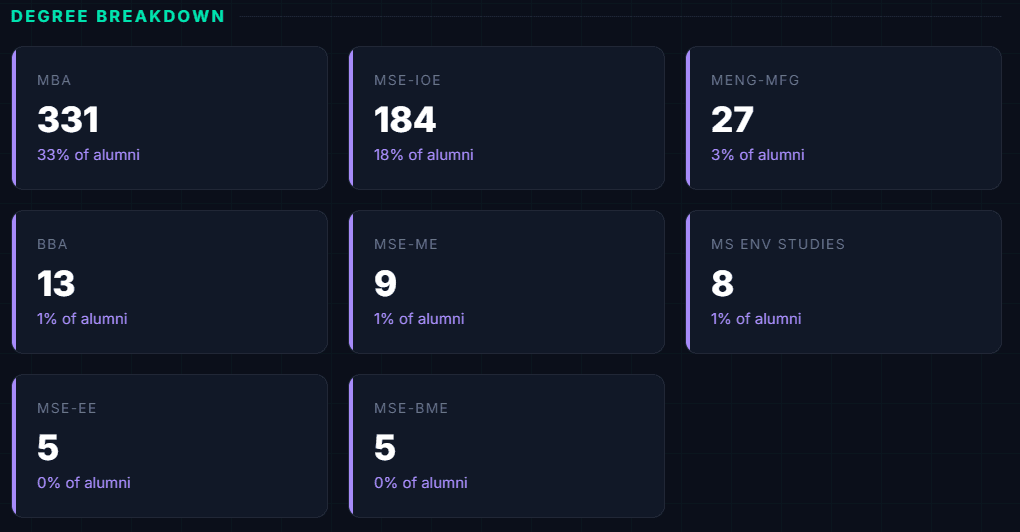
🎯 The Recommendation
Traditional Planning
Seattle: chosen year after year on historical assumption, not on where alumni actually are today.
Data-Informed Planning
Seattle ✓ still a strong hub, plus Chicago ↑ now visible as a real regional opportunity for future events and outreach.
This is the shift I recommended: keep evaluating event locations and outreach against what the data shows, every year, instead of repeating last year’s plan by default.
The HTML Alumni Analyzer
The tool behind the recommendation
Runs entirely in the browser: Tauber uploads its own spreadsheet, and nothing leaves the computer. No server, no subscription, no ongoing cost. Every time the file is updated, the same tool resurfaces these patterns, turning event and engagement planning from a one-time guess into an ongoing, evidence-based process.
📈 Lasting Impact
Immediate
• Reusable alumni analytics
• Faster exploration of historical data
• Evidence-based recommendations
Long-Term
• Supports annual event planning
• Helps identify emerging alumni hubs
• Continues working as new alumni are added
• Foundation for future engagement initiatives
The most valuable outcome wasn’t a dashboard; it was giving the Tauber Institute a repeatable way to use its own data to guide alumni engagement decisions year after year.
🧭 Reflection
What this taught me about product strategy
I came into this engagement expecting to do data analysis: clean a spreadsheet, run some numbers, present a few charts. What I actually learned was closer to product strategy: the most valuable thing I could build wasn’t a report, it was a tool the client could keep using without me. That shift, from delivering an answer to building something that keeps producing answers, is the lens I now bring to every analytics project.
Isaac Tung led the Data Analytics workstream and Product Strategy at SOCHI Tech Consulting, building the HTML Alumni Analyzer within a 5-person team.